Scalem User Documentation – Scalem Windows in Detail
← Previous | Start | Next →
This document shows all Scalem windows in more detail and describes their interaction. After reading this page, you should have a good idea about how to use Scalem.
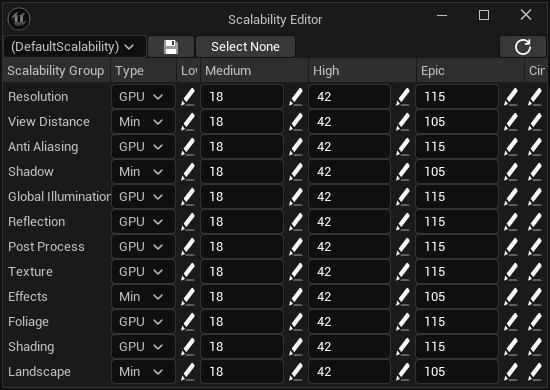
This editor lets you set up the quality level performance thresholds for all scalability groups.
One row per scalability group, it displays the PerfIndexThreshold fields and buttons for editing the console variables for each combination of a scalability group and the quality levels (see Console Variables Editor).
After editing the scalability, you can save the selected bundle by clicking the “Save” button.
If you want to save the selected preset as the new DefaultScalability.ini file, you can click the “Set” button.
The scalability editor also provides the functionality to select the “current” scalability bundle from a list of existing presets and the default scalability. This selection affects all the other Scalem windows.
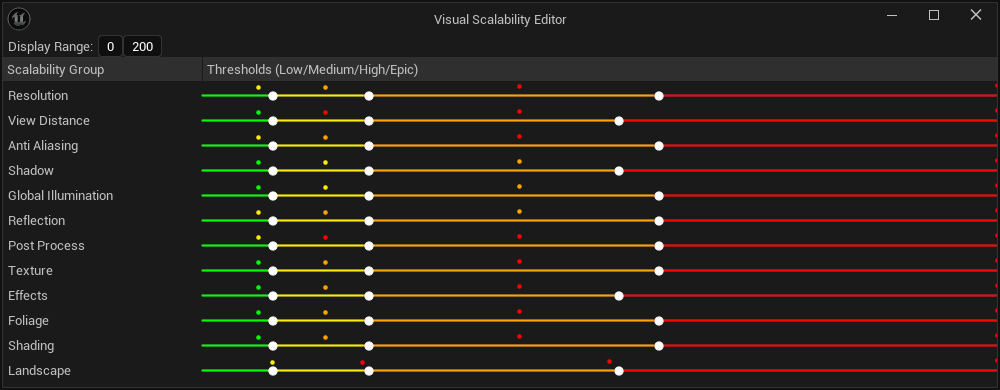
The visual scalability editor provides another way to edit the PerfIndexThresholds values for the currently selected scalability bundle.
For each scalability group, it provides a “multi slider” with three individual sliders which you can move around to set the threshold values.
To make your life even easier, it also plots the benchmark values and the target values of the selected scalability captures as small colored dots. The space between the slider handles is also colored accordingly, making it easy to match the thresholds visually.
The colors mean:
In the top bar, you can adjust the visualized range.
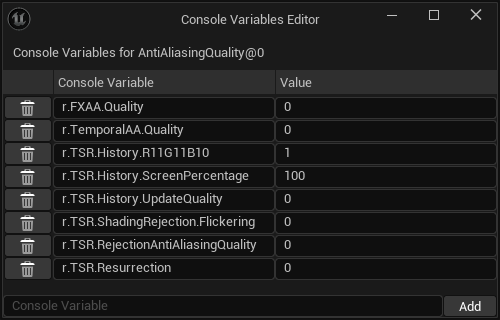
The console variables editor allows you to edit the CVars for the clicked scalability group at the specific quality level (see Scalability Editor).
Besides adjusting existing values, you can also add a new console variable or delete existing ones.
The “Value” field is a string of characters, allowing you to also add inline comments to the .ini file.
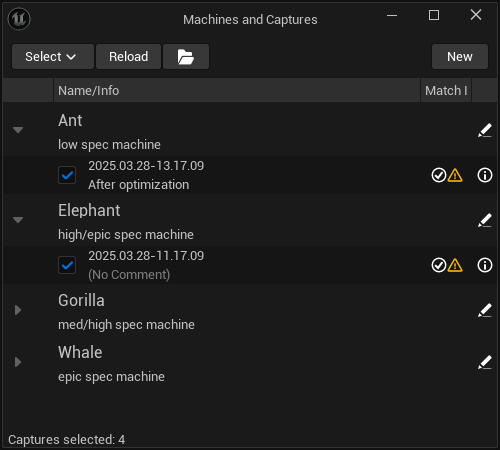
This editor lists all the loaded target machines and their captures. It allows you to select the captures you want to look at in more detail.
In addition to this, it allows you to edit the details for target machines, and view the details for scalability captures. Both of these features spawn new windows (see Target Machine and Scalability Capture Viewer).
Each scalability capture row also shows indicators of their performance compared to the target performance of their target machine. If a scalability bundle is selected, a second indicator will show the performance applied to the target machine based on the benchmark values of that capture.
The menu bar of that window shows buttons:

The bar plot visualizes your selected scalability captures. On the horizontal axis, it lists all the scalability groups, the vertical axis shows the different quality levels. Resolution Quality is an exception to this, as it’s not directly using quality levels, but the screen percentage instead.
Hovering over bars shows additional details.
The bar plot visualization has two different modi, which can be selected at the top:
Each bar is vertically split into two separate areas: the solid part, and a colored part. Depending on the situation, the colored part is red (“bad”) or green (“good”). Each bar shows the setting actually achieved in the scalability capture, compared to the performance that we wanted to achieve/would achieve, depending on the selected mode.
Note that “bad” and “good” are relative terms, as it can be interpreted as “good quality” or “good performance.”
The bar plot—as all the other windows—update automatically, so it’s easy to tweak the important values while watching the colors change.
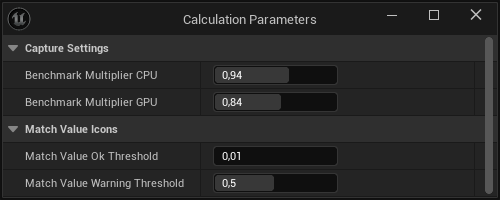
The calculation parameters editor lists all calculation parameters and allows you to edit them. These parameters are used for many different purposes.
A future version of this document will go into more detail, as this part of the tool is still under heavy development.
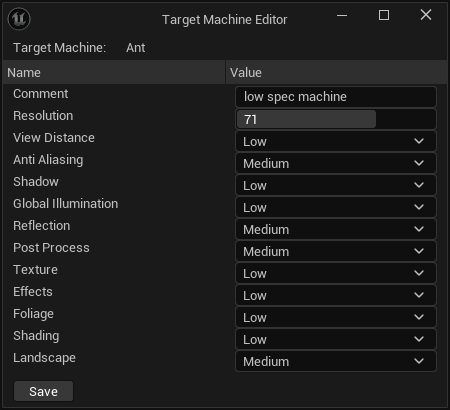
This window will be summoned by clicking the specific button in the Machines and Captures window.
It allows you to edit all important values for the specified target machine.
Note: It is currently not possible to change the name of a target machine using the GUI. It is possible to rename a target machine by manually editing the
.inifiles (target machine and the captures) and reopening the editor. If you do that, I recommend that you also rename the files to reflect that change.
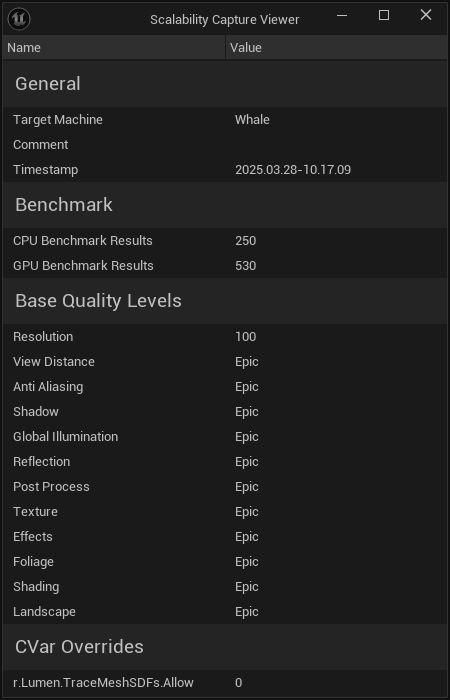
The scalability capture viewer is summoned by clicking the specific button in the Machines and Captures window.
It shows all the data of the specified scalability capture. There is no editing functionality.
It is possible to manually edit the
.inifiles directly.